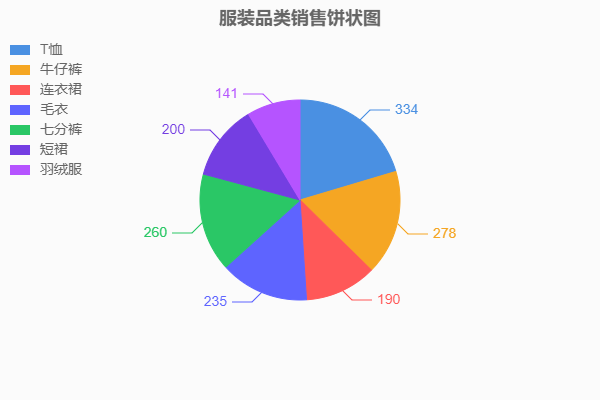
Pie chart
Use cases
HTML
JS
options
| parameter | explain | must | data type | default |
|---|
| datasets | chart data, detail | Yes | array | - |
| labels | the text of X axis | Yes | array | - |
| type | chart type, must be 'pie' | Yes | string | bar |
| showValue | display the value in the chart | No | boolean | true |
| topPadding | inside top margin of chart | No | number | 60 |
| leftPadding | inside left margin of chart | No | number | 50 |
| rightPadding | inside right margin of chart | No | number | 10 |
| bottomPadding | inside bottom margin of chart | No | number | 50 |
| bgColor | the background color of chart | No | string | #fff |
| title | the title of chart, detail | No | object | - |
| legend | the legend of chart, detail | No | object | - |
| radius | pie radius | No | number | 100 |
| colorList | the color list of chart | No | array | - |
datasets
| parameter | explain | must | data type | default |
|---|
| data | chart data | Yes | array | - |
title
| parameter | explain | must | data type | default |
|---|
| text | title text, do not display title if not transmitted | No | string | - |
| color | title color | No | string | #666 |
| position | title position, optional top and bottom | No | string | top |
| font | typeface | No | string | bold 18px Arial |
| top | when the position is top, the distance between the title position and the top of the canvas | No | number | 10 |
| bottom | when the position is bottom, the distance between the title position and the bottom of the canvas | No | number | 5 |
legend
| parameter | explain | must | data type | default |
|---|
| display | show legend | No | boolean | true |
| color | text color of legend | No | string | #666 |
| position | title position, optional top and bottom and left | No | string | top |
| font | typeface | No | string | 14px Arial |
| top | when the position is top or left, the distance between the legend position and the top of the canvas | No | number | 45 |
| bottom | when the position is bottom, the distance between the legend position and the bottom of the canvas | No | number | 15 |